
Coinbase
Accessibility of Data Visualizations
* This work is protected under an NDA.
ROLE
User Research Intern
TIMELINE
June 2022 - July 2022
GOALS
Understand the behaviors and pain points of those who use assistive technology for data visualization to inform product design decisions
METHODOLOGIES
Literature Review, Interviews, Affinity Mapping
Accessibility is key to providing inclusive user experiences for everyone. In order to increase economic freedom for all users, despite their ability or circumstance, the team needs to ensure that everyone can use Coinbase products with equal opportunities. An accessibility audit of Coinbase products identified 8 severity 1 issues related to data or data visualization. In order to remediate these issues, we needed to conduct research to develop our understanding of the needs and behaviors for users of assistive technology (AT) who interact with data or data visualization components.
Our research aimed to explore the journeys of AT users navigating data and discover opportunities to improve accessibility of Coinbase products. As the team needed more information on how to remediate the issues identified by the audit, research was necessary to inform how we can ensure equal access to Coinbase products for users of assistive technologies.
Project Journey
I was one of four user research interns working on this project. With my team, I created a research plan, recruited research participants through Fable, conducted six contextual interviews, analyzed data, wrote a research report, and presented our findings and recommendations to stakeholders. I took the lead on creating the moderator guide, facilitating two interviews (including the pilot), and analyzing data collected from those two interviews.
Business Objectives:
-
Inform design and development of existing and future products/features
-
Increase Coinbase's ability to be accessible for all
-
Increase retention of AT users by preventing blocking bugs related to accessible data visualizations
Research Questions:
-
How do users of assistive technology best interpret, navigate, and interact with data visualizations?
-
What is an accessible user experience when it comes to data?
-
How might we learn about their experiences to influence the way data is presented in Coinbase's suite of applications?
-
Which visualization would be most appropriate for specific data?
Research Goals:
-
Understand what an accessible user experience in the context of data visualization is
-
Identify major pain points and workarounds that AT users have when interacting with data visualizations
-
Establish which data visualizations are most appropriate for specific ATs, and how they can be adapted to be more appropriate
Foundational Research
Our research focused on users of three ATs: screen readers, screen magnification, and alternative navigation. To conduct effective and empathetic interviews, I built my foundational knowledge around understanding ATs and the meaning of accessibility in the Coinbase context.
1. Understanding Assistive Technology
Literature review, Expert interviews, Conversations with users of ATs
-
What are the different kinds of AT?
-
What does each AT entail?
-
How does each AT influence the user’s experience?
2. Accessibility in the Coinbase Context
Internal stakeholder interviews (Coinbase Staff Accessibility Lead, Staff User Researcher, and Coinbase Design System designers)
-
What does an accessible experience mean for Coinbase?
-
What is important to Coinbase in the context of an accessible experience?
-
What limitations does Coinbase have that we should know?
-
How can we ensure that we provide impactful and actionable product recommendations for the team (e.g., examples and presentation format)?
Interviews
Besides our research questions and goals, we utilized the information gathered from our foundational research to help write our moderator guide. To recruit participants and conduct our interviews, we used Fable, a platform that connects people with disabilities to user research and usability testing. Out of a total of five interviews (including the pilot), I moderated two and took notes for two others.
Challenge
Understanding the participants' experiences with data visualizations. Due to my lack of experience with ATs, it was hard for me to visualize the participants' descriptions of their experiences. As the rest of my team felt similarly, we resolved this by requesting participants to share their screens and walk us through their experiences. Having this visual aid as a complement to their verbal descriptions provided me important contextual nuances (e.g., what made them magnify their screen) and tangible examples (including video clips) to support the team's recommendations.
Analysis
Using Miro, I built an affinity map with my team to identify themes and insights from our interviews. Based on our goal of informing product and design decisions, we formed our themes, such as the display of continually updating information and feedback on system state changes. Leveraging the tag feature for sticky notes, we incorporated user sentiment (e.g., positive or negative experience) and tone into our insights. During the analysis stage, I took charge of evaluating data collected from the two interviews that I moderated and adding my findings to the affinity map.
.jpg)
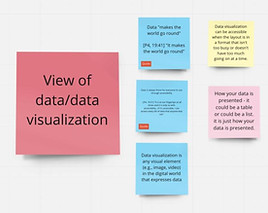
This is our affinity diagram on Miro, including a close-up image of one of our themes.
Research Report
We had five key insights with multiple product and design recommendations addressing different aspects of each insight. After we completed our research, we presented our findings and recommendations to the research team and the entire Coinbase Design System team (researchers, product designers, illustrators, product managers, and engineers). I also individually presented our research at the company-wide Final Intern Presentation.
Challenge
Conveying findings in an engaging and accessible manner to a diverse audience. My lack of knowledge about ATs made it difficult for me to deeply relate to the participants' experiences with data visualizations, and I knew my audience may feel similarly. Thus, my team and I included video clips of participants showing their experiences with ATs. Not only did this visually and auditorily engage our audience to share in the participants’ experiences, but it also highlighted the importance of implementing our recommendations.

Our 5 key insights
Outcome
At the end of this project, my team submitted our final deliverables:
-
Research plan
-
Research report
-
Video recordings of interviews
-
Summary notes of interviews
-
Presentation to stakeholders
Our work promoted the inclusivity of Coinbase products for assistive technology users:
-
Addressed 8 severity 1 issues outlined in an accessibility audit of Coinbase products with our recommendations
-
Informed Coinbase Design System (CDS) guidelines for building accessible data visualizations
-
Promoted awareness of assistive technology users among teams when designing data visualizations
Reflection
Navigating sensitive topics. Initially, I felt nervous about interviewing participants because of my lack of knowledge about ATs. Speaking with accessibility experts and studying about ATs, however, helped me be more empathetic and mindful of participants. During interviews, I managed to help participants feel comfortable and respected when discussing their experiences.
Delving into the experiences of alternative navigation users. Looking back on this project, I would have loved to extend the timeline of this project to beyond 1.5 months so that my team could interview more than five participants. The data gathered from our research was fascinating, and I appreciated the opportunity to learn so much about accessibility. However, our participant pool consisted of 2 screen reader users, 2 screen magnifier users, and 1 alternative navigation user. The particular lack of data about alternative navigation left me wanting more; I wanted to conduct further research with alternative navigation users to deepen my understanding of their experiences with data visualizations and enrich my insights to better inform the Coinbase team.